Image

UNECE Countries in Figures 2015
This publication gives a snapshot of the social and economic conditions in each of the member States, using statistical indicators from a wide variety of different domains, ranging from GDP per capita...
This publication gives a snapshot of the social and economic conditions in each of the member States, using statistical indicators from a wide variety of different domains, ranging from GDP per capita...
UNECE Countries in Figures 2013
This publication gives a snapshot of the social and economic conditions in each of the member States, using statistical indicators from a wide variety of different domains, ranging from GDP per capita...
This publication gives a snapshot of the social and economic conditions in each of the member States, using statistical indicators from a wide variety of different domains, ranging from GDP per capita...
UNECE Countries in Figures 2017
UNECE Countries in Figures presents a profile of social and economic indicators for each of the 56 UNECE member countries. These profiles, prepared by the UNECE Statistical Division, are intended to...
UNECE Countries in Figures presents a profile of social and economic indicators for each of the 56 UNECE member countries. These profiles, prepared by the UNECE Statistical Division, are intended to...
UNECE Countries in Figures 2019
This publication presents a profile of social and economic indicators for each of the 56 UNECE Member States. These profiles, prepared by the Commission's Statistical Division, are intended to be of...
This publication presents a profile of social and economic indicators for each of the 56 UNECE Member States. These profiles, prepared by the Commission's Statistical Division, are intended to be of...
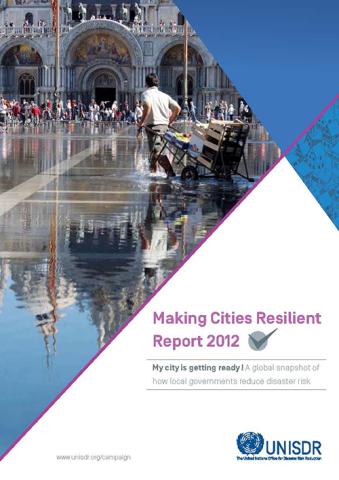
Making Cities Resilient Report 2012
My City is Getting Ready - A Global Snapshot of How Local Governments Reduce Disaster Risk
This report is a product of cities' and local governments' efforts to protect their cities and make them safer and productive places to live and work. Today, with more that half of the world's...
This report is a product of cities' and local governments' efforts to protect their cities and make them safer and productive places to live and work. Today, with more that half of the world's...